Dashboard examples
Interactive sample data and browser demonstrations. Every value is illustrative.
Dashboard views
Four views of the same fictional dataset. Range and scenario control every representation.
Completed358
Automated share47%
Avg. handling38m
Delayed81
Illustrative sample dataWork mix
Direct comparison
Bars make automated and manual work directly comparable.
Change the range or scenario and compare the shares.
Flow over time
Signal and exceptions
A bright line follows completed work while the stepped line keeps delays visible.
Move the pointer across the lines to inspect individual days.
Accumulated activity
Volume and pressure
Stacked areas show total load and how delays add to the active queue.
Compare the areas; use “View data” for exact daily values.
Stacked area for 30 days in the Normal week scenario: 358 completed and 81 delayed. Exact daily values are available through “View data”.
Handling-time bands
Distribution
A stippled histogram shows where days cluster by handling time.
Change the range and watch how the distribution shifts.
Each stippled band groups days by average handling time.
How these visual styles were made
The comparison chart uses TanStack Charts. The stacked area uses Apache ECharts. The time series adapts NeonBlade UI’s MIT-licensed Recharts component. The stippled distribution is an original implementation inspired by Dither Kit; no Dither Kit source is included.
Interactions
Five working experiments and one illustrative code image show different forms of feedback, typography, and state.
Tactile action
Depth and movement give an important action clear physical feedback.
Open Contact with mouse, touch, or keyboard.
Keyboard focus and press depth are part of the component.
Signal pattern
An adjustable dot field gives loading and status moments character without obscuring content.
Use the slider to set a different signal density.
Text reveal
A short reveal gives a product moment energy and settles into readable text.
Cycle or copy the visible phrase.
Test text width
The estimate uses the available space for stable lists and content-heavy tools.
Resize the column and compare the prediction with the real wrap.
Complex work becomes easier when the interface explains what matters, what changed, and what to do next.
Explain states
Selection, availability, and disabled state remain clear without relying on hover.
Switch between available tones and inspect each state.
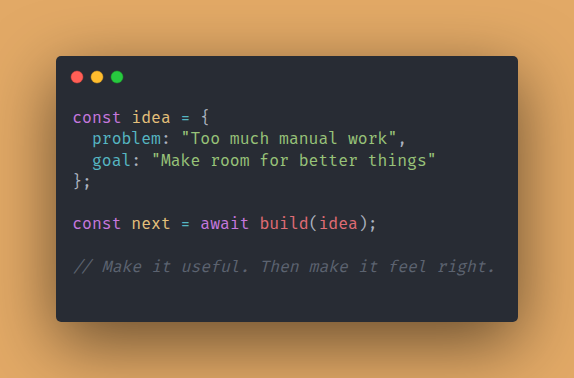
Illustrative code image
A short snippet shows the approach from a concrete problem to a useful implementation.
Read the image or use its complete text alternative.
Reference credits for these experiments
The tactile action references Evil Buttons; the adjustable signal references Dot Matrix; the reveal references Remocn typography; the live-width specimen uses Pretext; and the state control references Shark UI’s primitive approach. Implementation and licensing details are recorded in THIRD_PARTY.md.